Dredging Runs on Volumes
Every dredging project is a volume argument. The budget is set from an estimated quantity, the contractor bids against it, the pay applications cite removed material, and the closeout hinges on whether the basin now holds what the contract said it would. When those numbers come from old drawings or probe-pole spot checks, everyone in the room is negotiating from a guess.
A bathymetric survey replaces the guess. Flown before the project, it establishes the true existing bottom and the real quantity to move — the number the bid should be built on. Flown after, it verifies what was actually removed and documents the achieved depths. Flown on an interval, it turns sedimentation from a surprise into a curve you can budget against.
The Before-and-After That Settles Pay Disputes
- Pre-dredge survey. Full-coverage sonar grid establishing the existing bottom surface, soft-sediment thickness where dual-frequency data resolves it, and the removal volume to design depth — computed surface-to-surface, not sampled and extrapolated.
- Post-dredge verification. The same grid reflown. The difference between the two surfaces is the removed volume, and the comparison against design grade shows exactly where the contract depth was achieved and where it was not.
- Quantity documentation. Surfaces, difference maps, and volume tables delivered in formats your engineer and your contractor can both open — the shared reference that keeps the closeout conversation short.
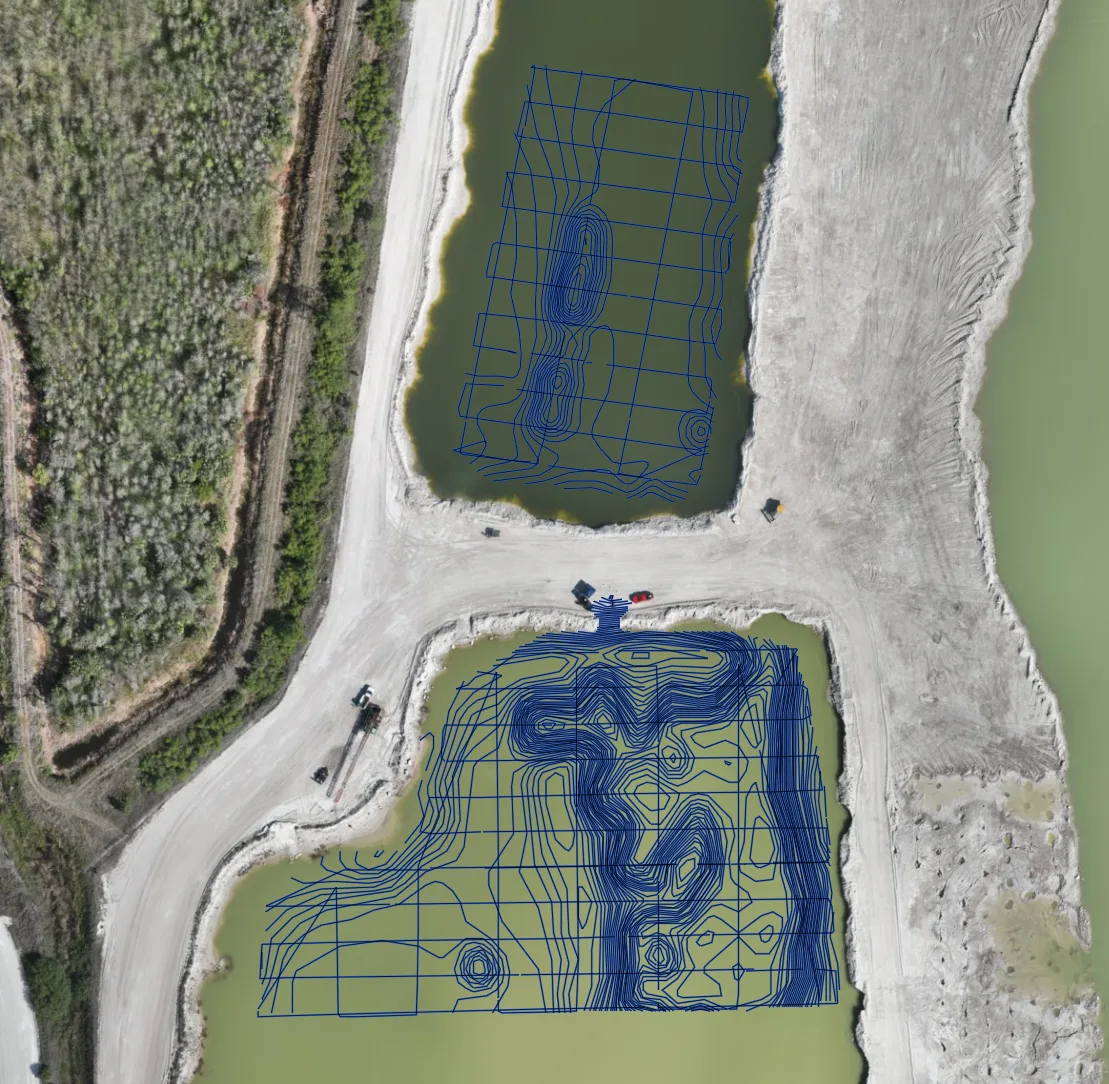
A real pre-dredge deliverable: sonar-derived depth contours overlaid on the same flight's orthomosaic — two active dredge ponds, mapped while the operation kept running.
Sedimentation Monitoring Between Dredges
Basins do not fill up on a schedule; they fill up on a curve driven by weather, inflow, and upstream land use. Repeat surveys — annual, or after major runoff events — measure the accumulation directly: where the sediment is depositing, how fast, and how much capacity remains against the trigger that forces the next project. For stormwater ponds, lagoon cells, sediment basins, and intake structures, that curve converts an unpredictable capital surprise into a planned line item.
Deliverables
- Bottom surface models — current bed as GIS/CAD-ready surfaces, on a repeatable grid
- Volume computations — removal quantities to design grade, or accumulation since the last survey, with the method stated
- Difference maps — color-mapped cut/fill between any two surveys or against design
- Soft-sediment thickness where dual-frequency sonar resolves the layer
- Survey report — datum, water surface elevation, calibration, coverage, and confidence
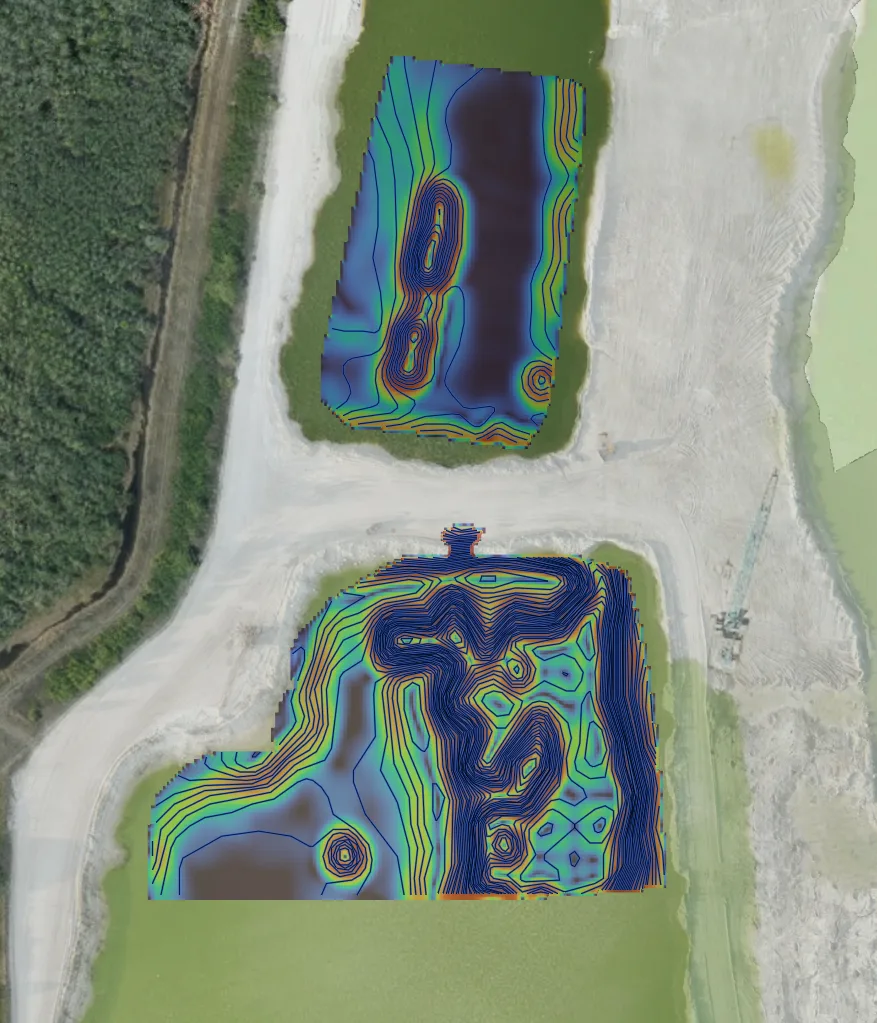
The same basins as a depth heat map — dark is deep, warm-ringed shallows show where material stands. This is the surface the removal volume is computed from.
Why From a Drone
Active lagoons, settling ponds, and intake areas are places nobody should be putting a boat if they can avoid it. The sonar flies the grid above the water: no launch access needed, no confined-water boat handling, no interruption to the operation, and the same tight grid every survey — which is exactly what makes repeat comparisons honest.
Northern Drone provides geophysical and aerial data-acquisition services. We are not a licensed land surveying or engineering firm, and "survey" on this page is used in the data-collection sense. Where certified quantities are required, licensed partners review and stamp the final product. Read the full licensure disclosure.