Seeing Crop Stress Before It Is Visible
By the time a problem is obvious from the cab, yield has already been lost. Nitrogen deficiency, early disease pressure, compaction, and irrigation failure all show up in how a plant reflects light well before they show up in how it looks.
Healthy vegetation absorbs most visible red light for photosynthesis and reflects near-infrared strongly. Stressed vegetation does the opposite — it reflects more red and less near-infrared. A multispectral sensor measures those bands separately, which turns an invisible physiological change into a map you can act on.
We fly a four-band multispectral array — green at 560 nm, red at 650 nm, red edge at 730 nm, and near-infrared at 860 nm — alongside a 20 MP RGB camera, capturing all of it in a single pass. The red-edge band is the one that matters most in practice, because it is what makes NDRE possible where NDVI has already saturated. RTK positioning is integrated, so imagery is geotagged to centimetre level without laying ground control across a field.
That is the whole basis of the service. Not prettier field photos, but a measurement that precedes the symptom.
Which Index for Which Question
Index selection is not interchangeable, and the wrong one gives a confidently misleading map.
- NDVI is the general-purpose vigour index and the right default for stand establishment, gap detection, and whole-field variability. Its weakness is saturation — in a dense closed canopy it flattens out and stops discriminating.
- NDRE uses the red-edge band and keeps working where NDVI saturates. For mid and late season nitrogen assessment in a closed canopy it is the more useful of the two, and it is the one most often requested by agronomists once they understand the difference.
- SAVI adjusts for soil background, which matters early in the season when exposed soil between rows skews a straight NDVI reading.
- Thermal maps canopy temperature. Because plants cool themselves by transpiring, a warm patch generally means water stress, and it will show before the canopy visibly wilts. It is also the fastest way to find a blocked emitter or a failed pivot zone.
Why Calibration Decides Whether the Map Is Usable
An uncalibrated multispectral map is a picture. A calibrated one is a measurement, and the difference matters entirely if you intend to compare flights.
Reflectance readings shift with sun angle, cloud cover, and haze. Fly the same field at 9am and 2pm without correcting for it and the two maps will disagree — not because the crop changed, but because the light did. Our multispectral platform carries a built-in sunlight sensor that records solar irradiance for every image, so the output is normalised reflectance rather than raw brightness.
This is what makes in-season comparison valid. Tracking a stressed zone across three flights only tells you something if all three are on the same scale.
If you plan to compare flights over a season, ask how reflectance was calibrated. Without per-image irradiance correction, the differences you are looking at may be weather rather than crop.
Deliverables Built for Your Platform
- Index rasters — NDVI, NDRE, SAVI, or thermal — as GeoTIFF with the scale documented
- Prescription-ready zone maps as shapefile for variable-rate application
- High-resolution RGB orthomosaic for scouting and ground-truthing what the index flagged
- KMZ for quick review on a phone or tablet in the field
- Comparison maps between flights where a baseline exists
Formats are matched to your farm management platform rather than exported generically. Tell us what you run and the data arrives ready to load.
Where It Earns Its Cost
Variable-rate nitrogen
NDRE zones in a closed canopy support differential application rather than a flat rate, which is where the input saving usually pays for the flight.
Irrigation troubleshooting
Thermal finds blocked emitters, failed pivot zones, and leaks quickly across a large area — often the fastest payback of any product here.
Stand establishment and replant decisions
Early-season gap and population mapping quantifies a marginal stand instead of leaving the replant call to a windshield estimate.
Drainage and compaction patterns
Persistent stress patterns that recur in the same place year after year usually indicate a physical soil problem rather than a nutrition one, and mapping them across seasons is how that gets diagnosed.
Turf and specialty
The same workflow applies to golf course turf health, sod production, and high-value horticulture where per-acre value justifies close monitoring.
What This Will Not Do
An index map shows you where a problem is, not what it is. A stress zone could be nitrogen, water, disease, insects, or compaction, and the map narrows where to walk rather than replacing the walk. Species identification and disease diagnosis from the air remain unreliable, and we will not claim otherwise. The value is in targeting your attention efficiently across a large area.
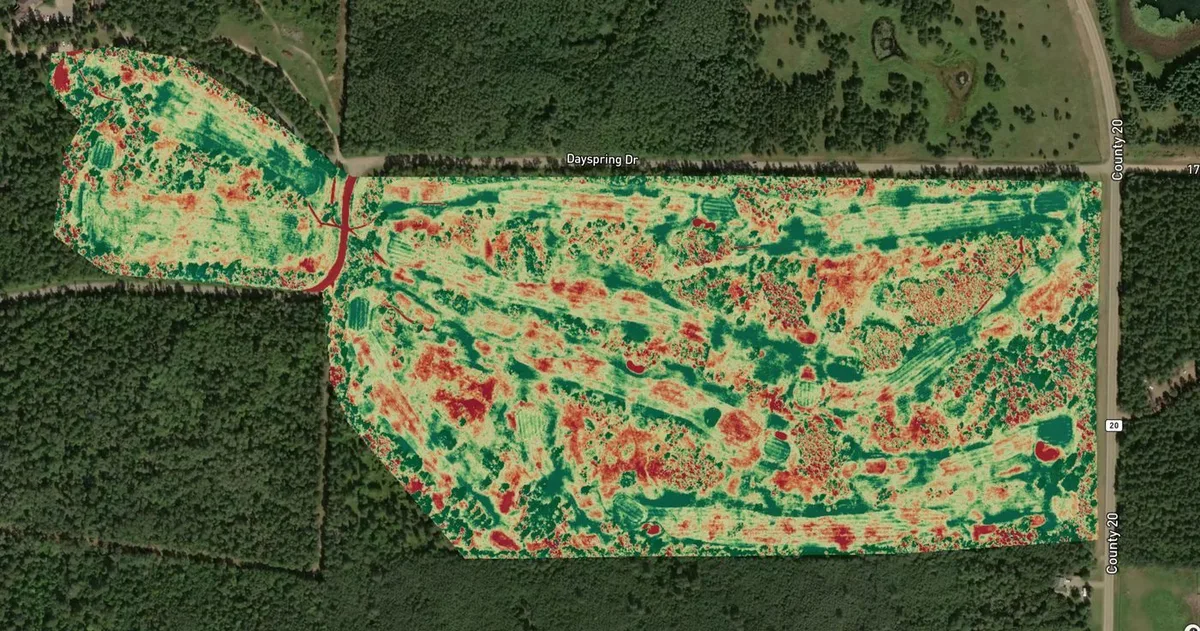
An NDVI map separating stressed zones from healthy stands — the same workflow applies to row crop, turf, and specialty.