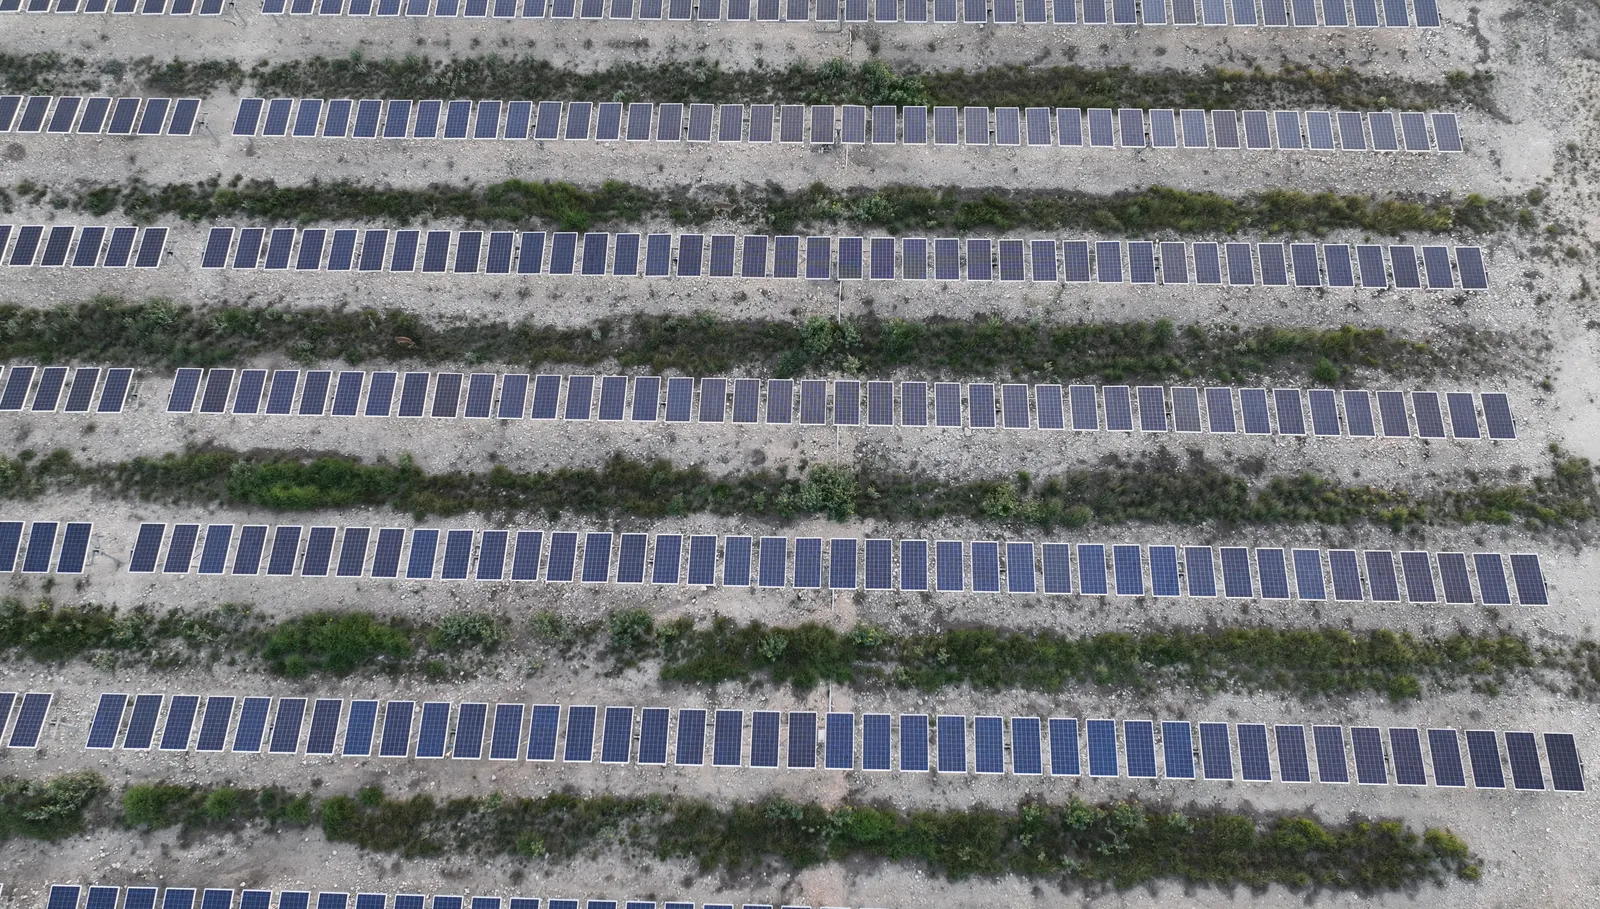
Why Underperformance Hides at Array Scale
A utility-scale array can lose meaningful production without anything showing on the monitoring dashboard. Inverter-level or string-level telemetry aggregates across hundreds of modules, so a handful of failed cells, a bypassed substring, or progressive delamination gets averaged into noise. The loss is real and it is invisible at the resolution you are monitoring.
Walking the array with a handheld imager finds those faults. On a large site it also takes weeks, and by the time the crew reaches the far end the conditions have changed enough that the readings are not comparable.
Thermal survey from the air solves the coverage problem. A failing cell dissipates energy as heat instead of converting it, so the electrical fault becomes a thermal signature — and thermal signatures can be imaged across an entire site in a single flight window.
What the Thermal Signatures Actually Mean
Different faults look different, and reading them correctly is the difference between a useful report and a list of warm spots.
- Single-cell hotspots — localised heating from a cracked cell, a solder failure, or shading damage. Often the earliest detectable stage.
- Substring or bypass-diode patterns — a uniformly warm block of cells indicating a bypass diode has activated or failed, typically costing a third of that module's output.
- Whole-module signatures — an entire panel warm or cold relative to its neighbours, pointing to a connection failure or a module taken out of circuit.
- String-level patterns — a contiguous run of modules reading differently, which usually indicates a wiring, combiner, or inverter input problem rather than a module problem.
- Delamination and PID — diffuse, progressive thermal gradients across a module face rather than a discrete point.
- Soiling and vegetation shading — recoverable losses that are worth separating from actual defects, because the remedy is maintenance rather than replacement.
Reading the Signatures
The value in a thermal survey is not the images, it is the classification. Four patterns account for most of what a survey finds, and each points at a different repair — or at no repair at all.
Why Survey Conditions Are Not Negotiable
This is the part that separates a defensible thermal survey from an expensive set of images, and it is where most of the operational discipline sits.
- Irradiance must be sufficient. Industry practice calls for a minimum threshold — commonly around 600 W/m² — because a fault needs to be under electrical load to generate a detectable thermal difference. Survey a low-irradiance morning and real faults simply will not appear.
- Clear, stable sky. Intermittent cloud changes module temperature between passes, which makes readings across the site non-comparable.
- Low wind. Convective cooling suppresses thermal contrast and can mask a genuine hotspot entirely.
- Radiometric capture, not colorized video. Every pixel needs a measurable temperature value so that thermal deltas can be quantified rather than eyeballed.
- Correct view angle. Off-angle imaging introduces reflection artifacts that read as false hotspots on a glass surface.
A thermal survey flown outside irradiance and wind limits will return a clean-looking report with real faults missing from it. That is worse than no survey, because it creates false confidence. Ask what the conditions were.
Roofs, Buildings, and Equipment: The Same Sensor, A Different Service
A radiometric payload does not care what it is looking at, but the physics, the flight conditions, and the reporting change completely when the target is a roof assembly, a building envelope, an electrical panel, or a rooftop unit rather than an array. We treat that work as its own discipline. Roof moisture surveys, envelope inspections, and electrical and mechanical thermography are covered on the drone thermal inspection page — including why trapped moisture reads warm after sunset and cool under solar loading, and what a defensible thermal report has to record.
Deliverables
- Fault list keyed to module position — table or row identifier, not just a pin on a map, so a technician can walk directly to it
- Georeferenced thermal orthomosaic of the full array
- Individual radiometric images of each flagged anomaly with measured temperature delta
- Severity classification separating urgent electrical faults from monitoring items and from recoverable soiling
- RGB orthomosaic for visual correlation and physical damage assessment
- Condition report recording irradiance, ambient temperature, wind, sky state, and time relative to sunset at survey time — so the results can be assessed and repeated on the same basis
- On roof work: a full-roof thermal orthomosaic, a finding-location map keyed to each anomaly, approximate affected area per finding, and a plain-language status per area — good, monitor, moisture, inspect equipment, or repair
Reporting conditions is not padding. It is what allows a follow-up survey next year to be compared against this one meaningfully.
Where This Gets Used
Commissioning and acceptance
Establishing a baseline at handover, and identifying installation defects while they are still the EPC contractor's responsibility rather than yours.
Warranty claims
Module warranty claims need documented evidence. Radiometric imagery with measured deltas and recorded survey conditions is considerably stronger than a description.
Annual O&M inspection
Full-site coverage in a single window instead of weeks of handheld work, with year-over-year comparison to show degradation trends.
Pre-acquisition due diligence
Independent condition assessment of an operating asset before purchase, at a level of coverage a sampling walkthrough cannot match.
Post-event damage assessment
Rapid array-wide assessment after hail, wind, or storm damage, combining thermal and RGB for insurance documentation.
What Thermal Will Not Tell You
Thermal imaging localises and characterises anomalies. It does not replace electrical testing — IV curve tracing and electroluminescence remain the tools for root-cause confirmation on a specific module. Micro-cracks that are not yet dissipating heat will not appear. And a warm module is not automatically a defective one, which is exactly why severity classification and recorded survey conditions matter more than the raw count of anomalies.
Further Reading
Drone Thermal Inspection — roofs, building envelopes, electrical and mechanical equipment, and utility components, with the capture conditions that make each survey defensible.
Thermal Roof Surveys: Does Moisture Read Warm or Cool? — why the capture window inverts the anomaly, and what a defensible thermal report has to record.