Drone Crop Survey for Agriculture
Crop stress shows up in how a plant reflects light well before it shows up in how it looks. Calibrated multispectral survey turns that into a map you can apply against.
The Problem Is Visible
Long Before You Can See It.
By the time a stress pattern is obvious from the cab, the yield loss has already happened. Nitrogen deficiency, early disease pressure, compaction, and irrigation failure all change how a plant reflects light well before they change how it looks.
Healthy vegetation absorbs most visible red light for photosynthesis and reflects near-infrared strongly. Stressed vegetation does the reverse. We fly a four-band array — green 560 nm, red 650 nm, red edge 730 nm, near-infrared 860 nm — with a built-in sunlight sensor correcting every image for the light it was captured under. That turns an invisible physiological change into a zone map you can apply against, and a thermal payload finds the irrigation faults causing it.
NDVI is the right default for stand establishment and early-season variability, but it saturates in a dense closed canopy and stops discriminating. NDRE uses the red-edge band and keeps working there, which makes it the better index for mid and late season nitrogen assessment. Using the wrong one produces a confident but misleading map.
Because plants cool themselves by transpiring, water-stressed areas read warmer than their surroundings. Blocked emitters, failed pivot zones, and line leaks show up across a large area well before the canopy visibly wilts. On irrigated acreage this is frequently the fastest payback of any survey product we offer.
Reflectance shifts with sun angle, cloud cover, and haze. Fly the same unchanged field at 9am and 2pm without correcting for it and the two maps disagree — the light changed, not the crop. Our multispectral platform carries a built-in sunlight sensor recording solar irradiance per image, so output is normalized reflectance — which is the only way tracking a zone across a season means anything.
Coverage exceeds 1,000 acres per day for multispectral work under normal conditions. Deliverables are formatted for your farm management platform rather than exported generically — index rasters as GeoTIFF, prescription-ready zone maps as shapefile, RGB orthomosaic for ground-truthing, and KMZ for review on a tablet in the field.
Stress that reappears in the same place season after season usually indicates drainage or compaction rather than nutrition. Mapping it across years is how that gets diagnosed — and where LiDAR terrain or airborne GPR can identify the physical cause underneath.
An index map tells you where a problem is, not what it is. A stress zone could be nitrogen, water, disease, insect pressure, or compaction. The map targets your scouting efficiently across a large area — it narrows where to walk rather than replacing the walk, and we will not claim reliable disease diagnosis from the air.
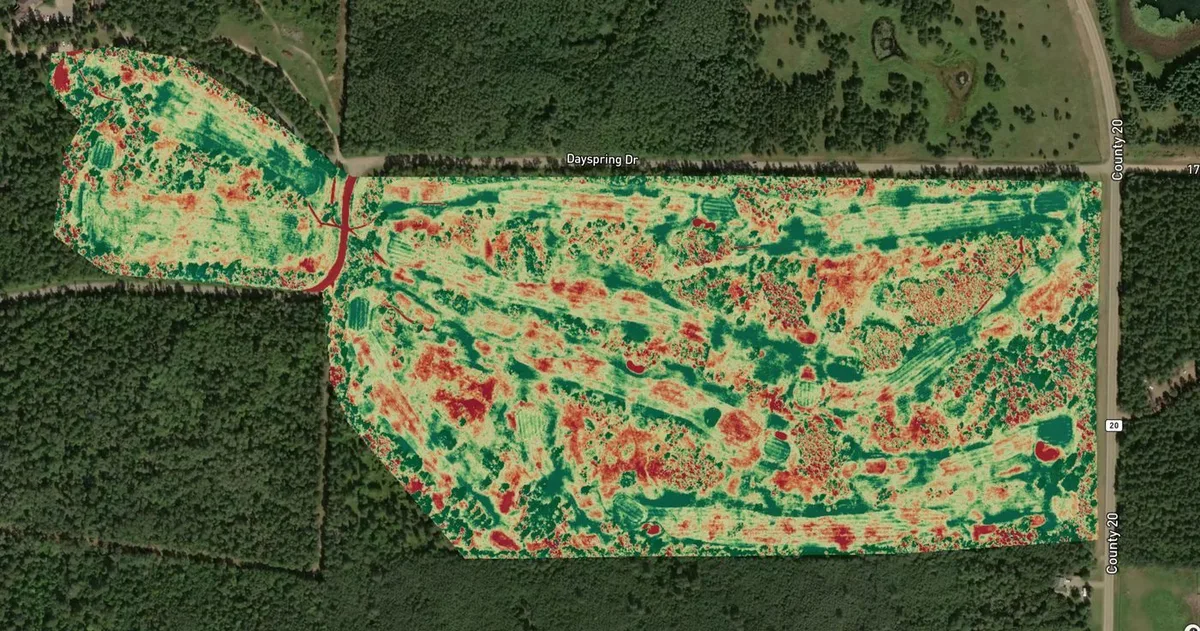
Calibrated NDVI/NDRE index rasters as GeoTIFF, prescription-ready zone maps as shapefile for your farm management platform, RGB orthomosaic for ground-truthing, and KMZ for tablet review in the field — formatted for the software you already run, not exported generically.
Working in Agriculture?
Tell us the site, the constraint, and what decision the data has to support. We will scope it honestly — including telling you when a cheaper method would do the job.